The Science Notebook
Gilbert Weather Bureau - Part IV

  Home   Terms of Use   Safety  Contact Us   Experiment Pages   Downloads   Supplies   Useful Links!

NOTE:  This book was published around 1920 as a manual to accompany the Gilbert Weather Bureau sets.  The sets and manual were part of the "Boy Engineering" series, While some of the experiments and activities here may be safely done as written, some of them may be considered hazardous in today's world, such as handling a mercury barometer.  In addition, some of the information contained in this book is either outdated or inaccurate.  Therefore, this book is probably best appreciated for its historical value rather than as a source for current information and good experiments.  If you try anything here, please understand that you do so at your own risk.  See our Terms of Use.

Pages 62 - End

62 GILBERT BOY ENGINEERING

NOTE:  Many figures have been relocated from their position in the printed text to make them more readable on a web page.  This may or may not be indicated in the text.

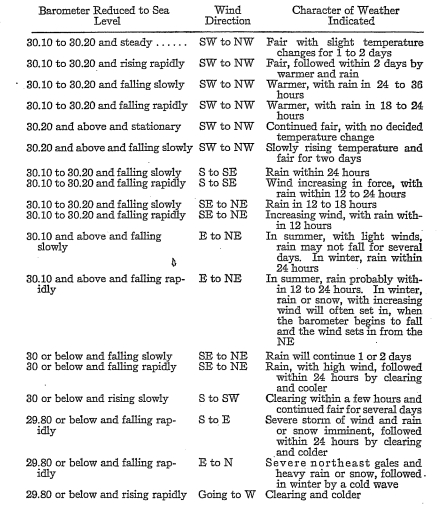
The following table of the United States Weather Bureau gives a summary of the wind and barometer indications:


GILBERT WEATHER BUREAU 63

A sudden fall indicates a sudden shower or high winds, or both. 

A stationary barometer indicates a continuance of existing weather conditions.  (Note: Tap the barometer slightly on the face.  If the hands move a trifle, it indicates that there is the tendency to rise or fall, depending upon the direction of movement of the hands.)

Northeasterly winds precede storms that approach from the southwest; that is, in New England and the Middle States and the Ohio Valley.  Southeasterly winds precede storms that approach from the Lake region. 

THERMOMETERS

For information regarding the manufacture of thermometers, we recommend P.R. Jameson's book, "Weather and Weather Instruments," published by the Taylor Instrument Companies of Rochester, N.Y. 

Thermometers are of great importance to us in determining weather. 

LOCATION OF THERMOMETERS

1.  They must be properly exposed. 
2.  A good circulation of air around them is necessary. 
3.  They must be properly protected from the rays of the sun. 

64 GILBERT BOY ENGINEERING

Note: If these instructions are not carefully followed out, errors are apt to occur, and you will be misled. 

For a change of wind towards northerly directions, a thermometer falls.  For a change of wind toward southerly directions a thermometer rises. 

MAXIMUM AND MINIMUM THERMOMETERS


Maximum and minimum thermometers are used to record the daily maximum and minimum temperatures.  Fig 46. shows a typical maximum and minimum thermometer used for giving the extremes of temperature.  One side of the thermometer has a scale reading, beginning at the top, from 60° below zero to 140° above zero.  This is the scale used when determining the coldest temperature reached during a day.  The other side of the thermometer has a scale marked from 70° below zero, beginning at the bottom and reading up to 130° above zero.  On this side the maximum heat reached during the day is recorded.  There is a small metal piece in the tubes, one on each side, and as the mercury pushes ahead or recedes, the small index is left at the lowest point reached in one tube and at the highest point reached in the other.  The small metal piece is drawn back to the level of the mercury by means of a small magnet. 

WHEN MAXIMUM TEMPERATURE IS REACHED

You can generally look for the maximum temperature between three and

GILBERT WEATHER BUREAU 65

[Originally contained Fig. 51]

66 GILBERT BOY ENGINEERING

four o'clock in the afternoon.  At this time the sun has reached its highest altitude. 

WHEN THE MINIMUM TEMPERATURE IS REACHED
 
This usually occurs a little while before sunrise.  It is important in weather observing to make a record of the highest temperature of the day and the lowest temperature of the night.  Continuous observation, as the reader will appreciate, is practically impossible for such a record. 

THE THERMOMETER FOR HUMIDITY IN THE AIR

The moisture or dampness in the air, as shown by an instrument called the hygrometer, increases before rain, fog, or dew. 

Before describing the hygrometer, a definition of a few of the terms used in conjunction with the instrument will be found useful. 

ABSOLUTE HUMIDITY

The amount of vapor actually present in the atmosphere is termed the absolute humidity, expressed usually either in the expansive force that the vapor exerts or in its weight in grains per cubic foot of air. 

RELATIVE HUMIDITY

The absolute humidity  divided by the amount of vapor that might exist in the air were saturated gives a ratio that is called the relative humidity. 

DEW POINT

The temperature at which moisture begins to be condensed on a cold vessel or other container and becomes visible is called the dew point. 

HOW HYGROMETERS ARE MADE

The most generally used hygrometer consists of two ordinary thermometers, the bulb of one being covered with a piece of muslin and kept constantly moistened with water by means of a wick or cotton thread communicating with a container of water.  The difference in the readings of the two thermometers, the wet and the dry, is observed, and knowing this, it is very easy to determine the

GILBERT WEATHER BUREAU 67

humidity by consulting a table (see table on pages 58-59), which has been prepared for this purpose.  These instruments are, according to the increase in price, equipped with a table, and the container is held in a wire frame, as you will see from Figs. 49-50 showing the standard Weather Bureau station instrument and the Gilbert hygrometer. 


Fig. 49 shows the U.S. Standard Weather Bureau Station Rain Gauge, Fig. 50 the Gilbert Rain Gauge and Fig. 51 the U.S. Standard Weather Bureau Station Rain Gauge, Tipping Bucket Type. 


The Gilbert Weather Station is equipped with the Tipping Bucket Type Rain Gauge.  Fig. 51 shows the apparatus clearly, complete and mounted ready for use.  The brass bucket seen in position through the open door is adjusted to tip for each hundredth inch of rainfall collected in the twelve-inch diameter receiver at the top, and this rainfall is electrically recorded at any convenient distance on a register.  After any desired period the water may be drawn off and check measurements made by means of the brass measuring tube and graduated cedar stick shown in the figure. 

THE GILBERT RAIN GAUGE (Fig. 50).


(a) Tube.
(b) Funnel.
(c) Measuring stick.

The essential parts of the Gilbert Rain Gauge consists of a metal tube twelve inches long, having a diameter of 1 5/16 inches (inside) and a funnel-shaped top, the neck of which fits snugly into the open end of the metal tube.  The outside diameter of the neck of the funnel is a trifle less than 1 5/16inches.  The area of the circle formed at the top of the tube is one-tenth of the area of the funnel circle.  A measuring stick is provided to measure the rainfall collected in the tube. 

To determine the amount of rainfall on the surface of the ground, the rain collected in the tube should be measured at regular intervals, usually twelve hours apart.  For every inch of rain collected in the tube, as denoted by the measuring stick, it means that there is one-hundredth of an inch of rain on the ground; if 10 inches of rain in the tube, his signifies one inch of rain on the ground.  In

68 GILBERT BOY ENGINEERING

other words, divide the figure recorded on the measuring stick by one hundred for actual rainfall. 

It is well to put some sort of a shelter around the gauge, so that it will be protected from strong winds.  The shelter is usually placed at a distance from the tube equal to the height of the tube.  With the Gilbert rain gauge it is well to erect the shelter at a distance of about three feet from the tube.  It is essential that the gauge be held in an upright position, so it should be fastened to the roof. 

Snow is measured by melting the quantity collected in the gauge and follow the same procedure as in rainfall measurements. 

There is another very common method, called ground measurement.  There are many instances where ground measurements are inaccurate:

1.  When snow and rain are mixed or alternate. 
2.  When melting accompanies snow fall. 
3.  When snow is already upon the ground. 
4.  When the amount of fall is very small. 
5.  When drifting is very bad. 
6.  When the snow is blown about after the storm and before measurements have been made. 

A bucket and a spring balance are used.  The bucket is filled with snow, but not packed down too hard, and weighed.  The reading of the index hand on the spring balance gives the density of the snow.  The depth of the snow in the vicinity of the spot from which the bucket was filled is obtained and this figure is multiplied by the density, thus giving the water equivalent of the snow collected.  For instance, if the reading of the balance was .16 and the depth of the snow was 7 inches, multiply .16 by 7, and the result, 1.12, is the water equivalent of the snow.

THERMOMETER SCALES

The the first thermometer scale to give satisfaction was devised in 1714 by Fahrenheit.  He determined the fixed points on the thermometer in a very novel manner.  Having been born at Dantzig, he took for the zero point on his scale the lowest temperature observed by him at Dantzig, which he found was that produced by mixing equal quantities of snow and sal-ammoniac.  The space between this point and that to to which the mercury rose at the

GILBERT WEATHER BUREAU 69

temperature of boiling water he divided into 212 parts.  He determined, with this thermometer, that the atmospheric pressure governed the boiling point of water.  Today the Fahrenheit thermometer is used extensively, and has for its freezing point 32° and for its boiling point 212°. 

Another scale that has not become too well known, because of the fact that it did not meet with public favor, was devised by Frenchman, named Reaumur, in 1730, and bears his name. He determine the freezing point of the scale at 0° and the boiling point of water at 80°. 

Another Frenchman, named Anders Celsius, developed a scale with the boiling point of water at 0° and the freezing point at 100°.  In 1743 a Frenchman, named Christin, living at Lyons, France, reverse the points, and today the scale is known as the Centigrade scale, and, together with the Fahrenheit scale, is used almost exclusively wherever thermometers are required. 

HOW TO CHANGE ONE SCALE INTO ANOTHER

Centigrade degrees into Fahrenheit: multiply by 9, divide the product by 5 and add 32. 

Fahrenheit degrees into Centigrade: subtract 32, multiply by 5, and divide by 9. 

Reaumur degrees into Fahrenheit: multiply by 9, divide by 4, and add 32. 

Fahrenheit degrees into Reaumur: subtract 32, multiply by 4, and divide by 9. 

Reaumur degrees into Centigrade: multiply by 5 and divide by 4. 

Centigrade degrees into Reaumur: multiply by 4 and divide by 5. 

WEATHER BUREAU STATIONS OF THE UNITED STATES AND WEATHER BUREAU MAPS

The following is a list of the weather bureau stations of the United States, and from many of these offices, preferably the one nearest you, you will be able to obtain the weather reports and weather map (see Fig. 52), indicating many things of interest, and from which you will be able to make a careful study of the weather.  

70 GILBERT BOY ENGINEERING

Abilene, Tex.
Albany, N.Y. 
Alphena, Mich. 
Amarillo, Tex. 
Anniston, Ala. 
Asheville, N.C.
Atlanta, Ga.
Atlantic City, N.J.
Augusta, Ga.
Baker, Ore.
Baltimore, Md.
Bentonville, Ark.
Binghamton, N.Y.
Birmingham, Ala. 
Bismarck, N.D. 
Block Island, R.I. 
Boise, Ida. 
Boston, Mass. 
Broken Arrow, Okla. 
Buffalo, N.Y. 
Burlington, Vt. 
Cairo, Ill. 
Canton, N.Y. 
Cape Henry, Va. 
Cape May, N.J. 
Charles City, Ia.
Charleston, S.C. 
Charlotte, N.C. 
Chattanooga, Tenn. 
Cheyenne, Wyo. 
Chicago, Ill. 
Cincinnati, Ohio
Clallam Bay, Wash.
Cleveland, Ohio 
Columbia, Mo.
Columbia, S.C. 
Columbus, Ohio
Concord, N.H.
Concordia, Kans. 
Corpus Christi, Tex.
Dallas, Tex.
Davenport, Ia.
Dayton, Ohio
Del Rio, Tex.
Denver, Colo.
Des Moine, Ia.
Detroit, Mich.
Devils Lake, No.Dak.
Dodge City, Kans.
Drexel, Neb.
Dubuque, Ia.
Duluth, Minn.
Eastport, Me.
Elkens, W. Va.
Ellendale, No. Dak.
El Paso, Tex.
Erie, Pa.
Escanaba, Mich.
Eureka, Cal.
Evansville, Ind.
Fort Smith, Ark.
Fort Wayne, Ind.
Fort Worth, Tex.
Fresno. Cal.
Galveston, Tex.
Grand Haven, Mich.
Grand Junction, Colo.
Grand Rapids, Mich.
Green Bay, Wis.
Greenville, S.C.
Groesbeck, Tex.
Hannibal, Mo.
Harrisburg, Pa. 
Hartford, Conn.
Hatteras, N.C.
Havre, Mont.
Helena, Mont.
Honolulu, Hawaii
Houghton, Mich.
Houston, Tex.
Huron, So. Dak.
Independence, Cal.
Indianapolis, Ind.
Iola, Kans.
Ithica, N.Y.
Jacksonville, Fla.
Juneau, Alaska
Kalispell, Mont.
Kansas City, Mo.
Keokuk, Iowa
Key West, Fla.
Kilauea, Hawaii
Knoxville, Tenn.
La Crosse, Wis.
Lander , Wyo.
Lansing, Mich.
Leesburg, Ga.
Lewiston, Idaho 


GILBERT WEATHER BUREAU 71  

Lexington, Ky. 
Lincoln, Neb. 
Little Rock, Ark. 
Los Angeles, Cal. 
Louisville, Ky.
Luddington, Mich.
Lynchburg, Va.
Macon, Ga.
Madison, Wis.
Manteo, N.C.
Marquette, Mich.
Memphis, Tenn.
Meridian, Miss.
Miami, Fla.
Milwaukee, Wis.
Minneapolis,  Minn.
Mobile, Ala.
Modena, Utah
Montgomery, Ala.
Mount Tamalpais, Cal.
Nantucket, Mass.
Nashville, Tenn.
Neah Bay, Wash.
New Haven, Conn.
New Orleans, La.
New York, N.Y.
Norfolk, Va.
Northfield, Vt.
North Head, Wash.
North Platte, Neb.
Oklahoma, Okla.
Omaha, Neb.
Oswego, N.Y.
Palestine, Tex.
Parkersburg, W. Va.
Pensacola, Fla.
Peoria, Ill.
Philadelphia, Pa.
Phoenix, Ariz.
Pierre, So. Dak.
Pittsburgh, Pa.
Pocatello, Idaho
Point Reyes Light, Cal.
Port Angeles, Wash.
Port Arthur, Tex.
Port Huron, Mich.
Portland, Me.
Portland, Ore.
Providence, R.I.
Pueblo,  Colo.
Raleigh, N.C. 
Rapid City. So. Dak.
Reading, Pa.
Red Bluff, Cal.
Reno, Nev.
Richmond, Va.
Rochester, N.Y.
Roseburg, Ore.
Roswell, New Mex.
Royal Center, Ind.
Sacramento, Cal.
Saginaw, Mich.
St. Joseph,  Mo.
St. Louis, Mo.
St. Paul, Minn.
Salt Lake City, Utah
San Antonio, Tex.
San Diego, Cal.
Sand Key, Fla.
Sandusky, Ohio
Sandy Hook, N.J.
San Francisco, Cal.
San Jose, Cal.
San Juan, Porto Rico
San Luis Obispo, Cal.
Santa Fe, New Mex.
Sault Sainte Marie, Mich.
Savannah, Ga.
Scranton, Pa.
Seattle, Wash.
Sheridan, Wyo.
Shreveport, La.
Sioux City, Iowa
Spokane, Wash.
Springfield, Ill.
Springfield, Mo.
Syracuse, N.Y.
Tacoma, Wash.
Temple, Fla.
Tatoosh Island, Wash.
Taylor, Tex.
Terre Haute, Ind.
Thomasville, Ga.
Toledo, Ohio
Tonopah, Nev.
Topeka, Kans.
Trenton, N.J.


72 GILBERT BOY ENGINEERING

Twin, Wash.
Valentine, Neb.
Vicksburg, Miss.
Wagon Wheel Gap, Colo.
Walla Walla, Wash.
Wichita, Kans.
Williston, No. Dak.
Wilmington, N.C.
Winnemucca, Nev.
Wytheville, Va.
Yankton, So. Dak.
Yellowstone Park, Wyo.
Yuma, Ariz. 


You will notice that on this map different lines are drawn: First, the Isobar lines - these are solid lines drawn through places which have the same barometric pressure.  Second, the Isotherm lines - these are dotted lines drawn through places having the same temperature. 

The Weather Bureau Maps are gotten out on the same day all over the country, and the preparation of them is quite interesting. 

At 7:40 A.M. simultaneous readings are taken at all weather bureau stations of the country.  On the coast, where the time is three hours different than in New York, the readings are taken at 4:40 so the hour corresponds at all places.  At 8:00 A.M. the various stations telephone their findings to the Western Union Office located in their city and immediately the messages are transmitted by Western Union to a central district office, or circuit center as it is called.  For New England, the circuit center is Boston.  All messages are received at this office, and from here transmitted to the next office, which is New York, and from New York to the next center, until the news is transmitted to the coast.  The wires are open from 8:00 until 9:30 A.M.  The western offices follow the same procedure until the weather indications are received by all stations.  Immediately the preparation of the map is begun and they are mailed to interested parties by the Weather Bureau Stations of the United States. 

Figs. 52, 53 and 54 show three maps, typifying storm traveling from the west to the east, and by studying them on successive days you can at once grasp the importance of studying the weather from these maps.


Fig. 53 shows a storm of low pressure and how this area of low pressure is progressing and moving from the west to the east.  Particular notice should be taken of how fast the storm travels, that is, the distance it goes each day, and the direction it is going and the results. 

The arrows denote the direction of the wind, and you will notice

[73]
[Originally contained Fig. 52]

[74]
[Originally contained Fig. 53]

[75]
[Originally contained Fig. 54]

76 GILBERT BOY ENGINEERING

they point to the region of low barometric pressure.  In the regions of high barometric pressure the winds are in the opposite direction.  This readily explains to you why it is that you can expect changes in weather conditions when the wind changes. 

From the markings and printed matter on each map, information is secured regarding observations of the barometer, thermometer, wind velocity, direction of the wind, kind of clouds, and their movements, and the amount of precipitation (rain or snow), in different localities. 

HOW THE STATE OF THE WEATHER IS INDICATED

The clear, partly cloudy, cloudy, rain or snow indications are symbolized.  The shaded area designates places or areas where precipitation has occurred during the preceding twelve hours. 

WHAT THE WORDS "HIGH" OR "LOW" MEAN ON THE MAP

Low barometric pressure, or the storm's centers, are indicated on the map by the word "low."  High barometric pressure centers are indicated by the word "high."  Note how they move in an easterly direction; how they are progressive.  They can be compared to a series of waves, which we will call atmospheric waves.  The crest of the wave may be likened to the "highs" and the troughs to the "lows."

Usually the winds are southerly or easterly and therefore warmer in advance of a "low." When the "lows" progress east of a place, the wind generally shifts to the westerly and the temperature lowers.  The westward advance of the "lows" is preceded by precipitation, and almost always in the form of rain or snow, following which the weather is generally clear.  Note how a "low" is followed by a "high," and so on as they move along eastwardly. 

WHAT ISOTHERMS INDICATE

If the Isotherms run nearly parallel, that is, east and west, there will most likely be no change in the temperature.  Southerly to east winds prevail west of the nearly north and south line, passing through the middle of a "high" and also the east of a like line passing through the middle of a "a low."

To the west of a nearly north and south line passing through the middle of a "low," northerly to westerly winds prevail.  We  

[77]
[Originally contained Fig. 55]

77 GILBERT BOY ENGINEERING

we will find the same condition prevailing to the east of a line passing through the center of a "high."

When we find an absence of decidedly energetic "lows" and "highs," this is an indication of the continuance of existing weather.  We can expect this state of the atmosphere until later maps show a beginning of a change, usually first appearing in the west. 

TRACKS OF STORMS IN THE UNITED STATES

The storms of the United States follow, however, year after year, a series of tracks, not likely to change suddenly, and not irregular, but related to each other by very well-defined laws. 


The United States Weather Bureau has made a very intensive study of the positions of tracks of the storms.  Fig. 55 shows the mean tracks and the movement of storms from day to day.  The map indicates that generally there are two sets of lines running west and east, one set over the northwestern boundary, the Lake region, and the St. Lawrence Valley, the other set over the middle Rocky Mountain districts and the Gulf States.  Each of these is double, with one for the "highs" and one for the "lows."  Furthermore, there are lines crossing from the main tracks to join them together, showing how storms pass from one to the other.  On the chart, the heavy lines all belong to the tracks of the "highs," and the lighter lines to the track of the "lows."
 
THE MODE OF TRAVEL OF THE "HIGHS"

A "high" reaching the California coast may cross the mountains near Salt Lake City (follow the track on the map), and then pass directly over the belt of the Gulf States, turning northeastward and reaching the Virginia coast; or it may move farther northward, cross the Rocky Mountains in the state of Washington, up the Columbia river valley, then turn east, and finally reach the Gulf of St. Lawrence.  These tracks are located where they are by the laws of general circulation of the atmosphere and the outline of the North American continent.  This movement of the "highs" from the middle Pacific coast to Florida or to the Gulf of St. Lawrence is confined to the summer half of the year, that is from April to September.  In the winter months, on the other hand, the source of the "highs" is different, though they reach the same terminals. 

GILBERT WEATHER BUREAU 79

HISTORICAL FACTS

THERMOMETERS

Galileo discovered the principles of the thermometer in 1592.  The Grand Duke of Tuscany, Ferdinand II, is given credit for perfecting it in 1610.  Athanasius Kirchner is given credit for the discovery of the mercurial thermometer.  This was about 1641.  Ferdinand the II, in 1650 or thereabouts, filled a glass tube with colored alcohol and hermetically sealed it after graduating the tube.  Fahrenheit is given credit for the discovery that water freezes always at the same temperature.  With these facts he devised a scale for thermometers in 1714. 

THERMOMETER RECORDS

A temperatures of 111° below zero has been recorded at an altitude of 48,700 feet in the United States. 

The highest record in the United States Weather Bureau was taken in Death Valley, Cal.on June 30, July 1 and 2, 1891, when the thermometer reached 122°F.  Death Valley is also given credit for the highest known monthly temperature, which was 102°F.  in the month of July.  Arctic expeditions have records of 73° and 66° below zero.  This is the greatest natural cold recorded.  The average temperature in the United States is 52.4°; the average temperature in England is 50°. 

In the interior of Australia a record has been taken of a drop of 60° to 70° in a few hours; whereas the most rapid change recorded in the united states was 60°F in 24 hours.  This record has been made twice, in 1880 and again in 1890. 

The lowest temperature recorded in the United States Weather Bureau was at Popular River, Montana, January, 1885,when the thermometer registered 63° below zero. 

The estimated heat of the sun is 10,000°; the highest artificial heat obtained is 7,000°.  Regarding the heat of the sun, no definite conclusions have been arrived at, so the above temperature is only approximate. 

REGIONS OF LEAST RELATIVE HUMIDITY

Least relative humidity is found in places southwest of Arizona, where the average is about 40°.  Fifty degrees humidity means half

80 GILBERT BOY ENGINEERING

as a much moisture as is necessary for complete saturation.  The average in other parts of the country is from 60° to 80°. 

Steel boils at 3,500°; water boils at 212°; liquid air submitted to a degree of cold where it ceases to be a gas and becomes a solid is 312° below zero.  Professor John Dewar of England is credited with some of the most remarkable experiments with low temperature, and at these temperatures made some wonderful discoveries.  He went down so cold that he could freeze liquid air back into a solid; he continued further until he reduced hydrogen, a very light gas, to a liquid.  This was a 440° below zero.  One of the most remarkable things he did was to freeze hydrogen into a solid. 

Water boils at 183.2° Fahrenheit on top of Mt. Blanc; water boils at 194° Fahrenheit on top of Mt. Quito. 

BAROMETERS

Torricelli is given credit for the discovery of the principles of the barometer.  Otto Von Guericke of Madgeburg, to whom we are indebted for the air pump, is credited as being the first person to use the barometer as a weather indicator. 

Because of the fact that the mercurial barometer is not adaptable for portability, many scientists began work on producing a barometer without fluid that could easily be carried about and would give accurate results.  In 1798 M. Comte, professor of aerostatics in the school at Meudon near Paris, invented the aneroid barometer, which he used in his balloon ascents.  This instrument has been described fully on page 55. 

BAROMETER RECORDS

Lowest reading taken in the United States by the United States Weather Bureau was 28.48, or practically three quarters of a pound per square inch below normal.  Altitude records have been taken with a barometer as high as 85,270 feet.  This record was made at Uccle Observatory, Belgium the pressure being 0.67° at this point. 

HAIL

Hail varies from one-tenth inch to more than 5 inches in diameter. 

The following is an extract from the "Memoirs of Benvenuto

GILBERT WEATHER BUREAU 81

Celline" of a terrible hailstorm in Lyons, France in 1544: "The hail at length rose to the size of lemons.  At about half a mile's distance all the trees were broken down, and all the cattle were deprived of life; we likewise found a great many shepherds killed, and we saw hail stones which a man would have found it a difficult matter to have grasped in both hands."

New Hampshire has the record for the largest hail stones seen here so far; they were 4 inches in diameter and weighed 18 ounces, and were 12 1/2 inches in circumferences. 

RAINFALL

There are records in Japan of where rain has reached 30 inches in twenty-four hours; in India where it has reached 40 inches in twenty-four hours. 

The average rainfall in the united states is 35 inches. 

There are certain places in India where the yearly rainfall averages over 470 inches; whereas other regions of India's show less than 4 inches. 

The higher the clouds are in the air; the larger the drops of rain when they reach the earth. 

The heaviest annual rainfall recorded any place in the world is on the Khasi Hills in Bengal, where it registered 600 inches.  The major part of this was in half of the year.

The greatest amount of rainfall is in the northwestern part of the United States; the least amount is in Arizona, the southwestern part.  In some parts of Egypt and Arabia, the only moisture that is received there is in the form of dew. 

The average cloudiness of the earth has been estimated between 50 and 55 percent.  This amount slightly exceeds the cloud conditions of the United States. 

Unalaska has a record of extreme clouding as for one whole month, February, 1880. 

Sir A. C. Ross, an Arctic explorer, recorded a shower of nearly an hour's duration on Christmas day, 1839, without a cloud in sight. 

A similar record was made on June 30, 1877, at Vevay, Ind., where a shower lasted for five minutes in a cloudless sky. 

A fall of yellow snow was recorded at south Bethlehem, Pennsylvania, in 1889.  Examination showed this coloration to be due to the  

82 GILBERT BOY ENGINEERING

pollen of the pine trees which had been blown into the atmosphere before the fall. 

Another record of yellow rainfall was recorded at Lynchburg on March 21, 1879. 

Golden snow was recorded at Peckolah, Germany, in 1877. 

Green and red snows have been observed during arctic explorations, due to a minute organisms that was in the atmosphere. 

When the temperature of the atmosphere is nearly 32° during a snowstorm and the wind is blowing, the flakes being damp and the snowfall heavy, the flakes are apt to unite to form large masses of snow in the atmosphere or air, which accounts for some of the following records:

At Chapston, Wales in January, 1888, the snowflakes measured 3.6 inches in length and 1.4 inches in breath, and 1.3 inches in thickness.  They amounted to 2 1/2 half cubic inches of water when melted. 

There are some remarkable instances of where hailstones have been cemented together, making large masses of ice. Some remarkable records of this kind have been recorded in India. 

In Morganstown Va., on April 28, 1877, hailstones 2 inches long and 1 1/2 inches in diameter fell. 

The mean yearly pressure of the United States ranges between 30 and 30.1 inches when reduced by ordinary methods to sea level. 

In Unalaska, January 21, 1879, the barometer reading of 27.70 inches was recorded, and another low reading was made at Stykkisholm of 27.91 inches om February 1, 1877.  On September 27, 1880, a ship on the China Sea experienced a terrific typhoon, during which the barometer went down in four hours from 29.64 to 27.04 inches. 

The greatest temperature ranges recorded are in the interior of Siberia, where at Yakutsk they recorded a range of 181.4°. 

The most remarkable changes recorded within 24 hours have been at Fort Maginness, Mont., January 6, 1886, a fall of 56.40°; at Helena, Mont., January 6, 1886, a fall of 55° in sixteen hours; at Florence, Ariz., June 26, 1881, 65° rise.  On the northern edge of the African desert the temperature of the air rose to 127.4°. 

The lowest single temperature in the world was recorded at Werchojansk, Siberia, in January, 1885, when it was 90.4° below

GILBERT WEATHER BUREAU 83

zero, while the average temperature for the month at the same place was 63.9° below zero. 

Highest mean rainfall occurs in Sumatra, averaging about 130 inches; the rainfall of 493.2 inches per year occurs at Cheripunji, Assam, India, which is the largest in the world.

The lowest rainfall in the world occurs at Southeast California, West Arizona, and the valley of lower Colorado, where the rainfall averages less than 3 inches. 

The most remarkable rainfall recorded in the United States for twenty-four hours occurred at Alexandria, La., June 15, 1886, when the rainfall reached the enormous amount of 21.4 inches.  The most remarkable rainfall recorded in the world occurred at Purneah, Bengal, September 13, 1879, when the rainfall reach the unprecedented amount of 35 inches in twenty-four hours. 

CLOUDBURSTS

On August 17, 1876, at Fort Sully, Dakota, occurred one of the heaviest cloudbursts ever known.  The water moved out of the canyon on the opposite side of the Missouri in a solid bank three feet deep and 200 feet wide.  There are many other remarkable cloudbursts recorded doing great injury, drowning and killing many people. 

WIND VELOCITY

Among the most remarkable wind velocity records is that of Cape Lookout on October 17, 1879, when the wind blew at a rate of 138 miles an hour. 

One of the worst cyclones ever recorded in North America was the flood, as it is usually termed, at Galveston, Tex.  This storm began on the 1st day of September, 1900, and lasted until the 12th.  It reached its maximum destructive force on the 8th.  6,000 lives were lost and $30,000,000 worth of property was destroyed. 

Even worse than any of these was the one at Calcutta in 1864, followed by a storm wave over 16 feet high, causing a death-rate of 45,000 persons. 

BLIZZARDS

The blizzard in Dakota of 1873 is one of the worst on record, but probably the most disastrous in the United States occurred in Montana, Dakota, and Texas on January 11, 1888.  The loss of life exceeded 100 persons. 

84 GILBERT BOY ENGINEERING

TORNADOES

The United States is more liable to tornadoes than any other part of the globe.  In the United States over 3,000 people have been killed by tornadoes and thousands more have been injured.  The greatest loss of lives recorded by tornadoes was at Adams City , Miss., on June 16, 1842, when 500 lives were lost. 

The most remarkable hailstorm was that of July 13, 1788 , through France to Belgium, and did a property damage of over five million dollars. 

There have been many destructive hailstorms in the United States.  On July 6, 1878, at central New York extended into parts of Massachusetts, Rhode Island and Connecticut.  Stones fell recorded to measure 7 inches in diameter. 

ROTARY MOTION OF STORMS

Benjamin Franklin has been given credit for the discovery that storms have a rotary motion, and that they move from west to east.  This discovery was made in 1747. 

Franklin did not positively prove these facts, and it remained for Redfield, Espy, Maury, Abbe to substantiate the truth of this statement. 

THE FIRST UNITED STATES WEATHER BUREAU

The first United States Weather Bureau was established in 1870.  General Albert J. Myer was the first chief of the United States Weather Bureau

It is estimated that we are 250,000 miles from the moon. 

At high altitudes, the cover of a kettle must be weighted down to in order to boil an egg hard.  This is to enable the pressure of steam to allow temperature high enough for  boiling.  In other words, it would be impossible to boil an egg in an open vessel at a high altitude. 

[85] MEMORANDUM
[End of text]

To the A.C. Gilbert Collection

 "The Science Notebook"  Copyright 2008-2018 - Norman Young